Process Count
The statistics were last updated Thursday, 15 October 2026 at 8:25,
at which time 'omc' had been up for 63 days, 21:16:34.
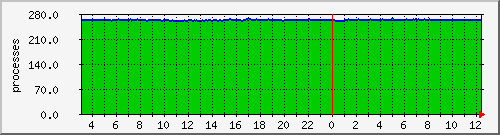
`Daily' Graph (5 Minute Average)
|
Max |
Average |
Current |
| Processes |
322.0 proc |
291.0 proc |
289.0 proc |
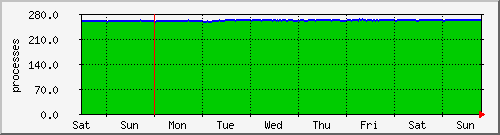
`Weekly' Graph (30 Minute Average)
|
Max |
Average |
Current |
| Processes |
303.0 proc |
288.0 proc |
291.0 proc |
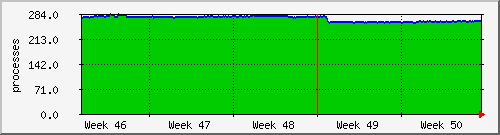
`Monthly' Graph (2 Hour Average)
|
Max |
Average |
Current |
| Processes |
293.0 proc |
285.0 proc |
290.0 proc |
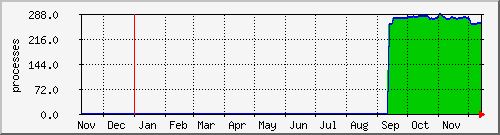
`Yearly' Graph (1 Day Average)
|
Max |
Average |
Current |
| Processes |
326.0 proc |
289.0 proc |
290.0 proc |
| GREEN ### |
Incoming Traffic in Bytes per Second |


